Showing posts with label Debugging. Show all posts

14 November 2012

How to find deadlocks in an ASP.NET application almost automatically


This is a quick how-to for finding deadlocks in an IIS/ASP.NET application running on a production server with .NET4 or .NET 4.5.

A deadlock bug inside your ASP.NET application is very ugly. And if it manifests only on some random production server of your web farm, maybe you feel like doom is immediately ahead. But with some simple tools you can catch and analyze those bugs.

These are the tools you need:
  • ProcDump from SysInternals   
  • WinDbg from Microsoft (Available as part of the Windows SDK (here is even more info)) 
  • sos.dll (part of the .NET framework)
  • sosext from STEVE'S TECHSPOT (Copy it into your WinDbg binaries folder)
ProcDump will be needed on the server where the deadlock occurs. All the other tools are only needed on your developer machine. Because WinDbg doesn't need any installation you can also prepare an emergency USB stick (or file share) with all the necessary tools.

If you think a deadlock occurred do the following:
  1. Connect to the Server
  2. Open IIS Manager 
  3. Open Worker Processes 
  4. Select the application pool that is suspected to be deadlocked
  5. Verify that you indeed have a deadlock, see the screenshot below
  6. Notice the <Process-ID> (see screenshot)
  7. Create a dump with procdump <Process-ID> -ma
    There are other tools, like Task Manager or Process Explorer, that could dump but only ProcDump is smart enough to create 32bit dumps for 32bit processes on a 64bit OS.
  8. Copy the dump and any available .pdb (symbol) files to your developer machine. 
  9. Depending on the bitness of your dump start either WinDbg (X86) or WinDbg (X64)
  10. Init the symbol path (File->Symbol File Path ...)
    SRV*c:\temp\symbols*http://msdl.microsoft.com/download/symbols
  11. File->Open Crash Dump
  12. Enter the following commands in the WinDbg Command Prompt and wait
  13. .loadby sos clr
  14. !load sosex
  15. !dlk
You should now see something like this:

0:000> .loadby sos clr
0:000> !load sosex
This dump has no SOSEX heap index.
The heap index makes searching for references and roots much faster.
To create a heap index, run !bhi
0:000> !dlk
Examining SyncBlocks...
Scanning for ReaderWriterLock instances...
Scanning for holders of ReaderWriterLock locks...
Scanning for ReaderWriterLockSlim instances...
Scanning for holders of ReaderWriterLockSlim locks...
Examining CriticalSections...
Scanning for threads waiting on SyncBlocks...
*** WARNING: Unable to verify checksum for mscorlib.ni.dll
Scanning for threads waiting on ReaderWriterLock locks...
Scanning for threads waiting on ReaderWriterLocksSlim locks...
*** WARNING: Unable to verify checksum for System.Web.Mvc.ni.dll
*** ERROR: Module load completed but symbols could not be loaded for System.Web.Mvc.ni.dll
Scanning for threads waiting on CriticalSections...
*** WARNING: Unable to verify checksum for System.Web.ni.dll
*DEADLOCK DETECTED*
CLR thread 0x5 holds the lock on SyncBlock 0126fa70 OBJ:103a5878[System.Object]
...and is waiting for the lock on SyncBlock 0126fb0c OBJ:103a58d0[System.Object]
CLR thread 0xa holds the lock on SyncBlock 0126fb0c OBJ:103a58d0[System.Object]
...and is waiting for the lock on SyncBlock 0126fa70 OBJ:103a5878[System.Object]
CLR Thread 0x5 is waiting at System.Threading.Monitor.Enter(System.Object, Boolean ByRef)(+0x17 Native)
CLR Thread 0xa is waiting at System.Threading.Monitor.Enter(System.Object, Boolean ByRef)(+0x17 Native)


1 deadlock detected.


Now you know that the managed threads 0x5 and 0xa are waiting on each other. With the !threads command you get a list of all threads. The Id Column (in decimal) is the managed thread id. To the left the WinDbg number is written. With  ~[5]e!clrstack command you can see the stacktrace of CLR thread 0x5. Or just use ~e*!clrstack to see all stacktraces. With this information you should immediately see the reason for the deadlock and start fixing the problem..


Deadlocked Requests visible in IIS Worker Process

Automate the Deadlock Detection

If you are smart, create a little script that automates step 2 to 7. We use this powershell script for checking every minute for a deadlock situation:


param($elapsedTimeThreshold, $requestCountThreshold)
Import-Module WebAd*
$i = 1
$appPools = Get-Item IIS:\AppPools\*
while ($i -le 5) {
ForEach ($appPool in $appPools){
 $count = ($appPool | Get-WebRequest | ? { $_.timeElapsed -gt $elapsedTimeThreshold }).count
 if($count -gt $requestCountThreshold){
$id = dir IIS:\AppPools\$($appPool.Name)\WorkerProcesses\ | Select-Object -expand processId
$filename = "id_" +$id +".dmp"
$options = "-ma"
$allArgs = @($options,$id, $filename)
procdump.exe $allArgs
 }
}
Start-Sleep -s 60
}

07 November 2012

Cooperative Thread Abort in .NET


Did you know that .NET uses a cooperative thread abort mechanism?

As someone coming from a C++ background I always thought that killing a thread is bad behavior and should be prevented at all costs. When you terminate a Win32 thread it can interrupt the thread in any state at every machine instruction so it may leave corrupted data structures behind.
A .NET thread cannot be terminated. Instead you can abort it. This is not just a naming issue, it is indeed a different behavior. If you call Abort() on a thread it will throw a ThreadAbortException in the aborted thread. All active catch and finally blocks will be executed before the thread gets terminated eventually. In theory, this allows the thread to do a proper cleanup. In reality this works only if every line of code is programmed in a way that it can handle a ThreadAbortException
in a proper way. And the first time you call 3rd-party code not under your control you are doomed.

Too make the situation more complex there are situations where throwing the ThreadAbortException is delayed. In versions prior to .NET 4.5 this was poorly documented but in the brand new documentation of the Thread.Abort method is very explicit about this. A thread cannot be aborted inside a catch or finally block or a static constructor (and probably not the initialization of static fields also) or any other constrained execution region.


Why is this important to you?

Well, if you are working in an ASP.NET/IIS environment the framework itself will call Abort() on threads which are executing too long. In this way the IIS can heal itself if some requests hit bad blocking code like endless loops, deadlocks or waiting on external requests. But if you were unlucky enough to implement your blocking code inside static constructors, catch or finally blocks your requests will hang forever in your worker process. It will look like the httpRuntime executionTimeout is not working and only a iisreset will cure the situation.

Download the CooperativeThreadAbortDemo sample application.

02 May 2010

Always databind SelectedItem before ItemsSource

The order in which bindings are defined in Xaml are relevant. Look at this Example: I have a ComboBox and a ViewModel. The ItemsSource of the ComboBox is bound to the Repositories property and SelectedItem is bound to SelectedRepository.

<ComboBox ItemsSource="{Binding Repositories}"
          SelectedItem="{Binding SelectedRepository}" />

The constructor of the ViewModel initializes the Repositories with a non empty collection and sets the SelectedRepository to the first element.

public ViewModel()
{
    Repositories = new List<string> {"First", "Second", "Third"};
    SelectedRepository = Repositories[0];
}

Yet, immediately after starting, I got null reference exceptions from other databound properties that are referencing the SelectedRepository property! After a little debugging I found out that when assigning the ViewModel to the DataContext of the view, the Binding Engine assigns null to the SelectedRepository! If you change the declaration of Databinding everything works as expected:

<ComboBox SelectedItem="{SelectedRepository}"
          ItemsSource="Repositories" />
Conclusion: the order of databinding declaration matters!

20 October 2009

IE8 Kompatibilitätsansicht für Intranetsites

Nachdem ich nun dem Table Layout abgeschworen habe und ins CSS Lager gewechselt bin, habe ich am Wochenende auch mein Hobbyprojekt SvnQuery auf CSS umgestellt. Das hat zwar etwas Mühe gekostet, aber dafür habe ich wieder etwas gelernt, das html hat eine klare Struktur und nebenbei wurden noch einige andere html Fehler beseitigt.

Zurück in der Arbeit aktualisierte ich auch die Suche der Firmenrepositories. Doch gleich bei der ersten Suche der Schock: Fette Scrollbalken schon auf der Startseite, offensichtlich wurde das Layout 200% breit statt wie gewünscht 100%. Und das auf dem IE8 gegen den ich hauptsächlich getestet hatte. Hatte ich schlecht getestet? Warum war mir das daheim nicht aufgefallen?

Also schnell das Projekt heruntergeladen, lokal installiert und ausprobiert. Und siehe da, das Layout war wie erwartet. Aber was war das Problem? Irgendwo musste es einen Unterschied geben. Entwickelt hatte ich gegen den ASP.NET Development Server, in der Firma läuft ein IIS6. Also schnell die Seite auf dem lokalen IIS gehostet. Doch auch hier wurde die Seite einwandfrei dargestellt. Jetzt wurde es mysteriös. Der einzige Unterschied, der noch blieb, war, dass auf meinem Enwicklungsrechner ein deutsches Vista mit IIS7 lief, und der Produktivserver mit einem englischen Windows Server 2003 und IIS6 arbeitete. Vielleicht ein Lokalisierungsproblem im IIS oder IE8? Ein Vergleich der Quelltexte von beiden Quellen zeigte zumindestens, dass der ASP.NET DataPager ein paar Texte lokalisierte (First ~ Erste, Next ~ Nächste, ...). Nachdem dies gefixt war, gab es aber auch hier keine Unterschiede mehr ... bis auf die Adressen der verlinkten CSS Stylesheets und Javscripts. Nun lernte ich, dass ASP.NET Scripts an dynamischen Adressen zum Nachladen generiert :
script src="/search/WebResource.axd?d=UV3-E5OwNGFcSb3I84w2&t=6391349351841...
Diese Scripte sind immerhin ca 20k groß und ihre Adresse ändert sich bei jedem Aufruf der Webseite. Vielleicht lag hier das Problem. Also speicherte ich die funktionierende Seite in ein lokales html file und bog händisch Schritt für Schritt die Links von der funktionierenden Quelle auf die nicht funktionierende um, in der Hoffnung irgendwann eine Seite mit dem zerstörten Layout zu erreichen.
Am Ende hatte ich jedoch eine lokale Seite mit Scripten und Stylesheets vom nicht funktionierenden Server, die immer noch das korrekte Layout anzeigte. Jetzt war ich völlig perplex!

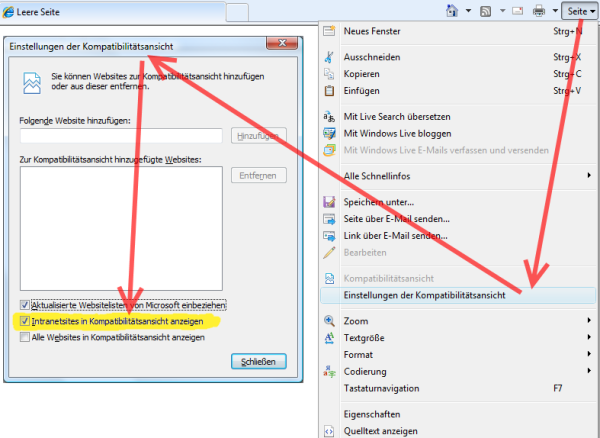
Ich lud nun die beiden Seiten, funktionierend und defekt, in zwei Tabs des IE8. Während ich versuchte, mir eine neue Hypothese für dieses seltsame Verhalten auszudenken, schaltete ich immer zwischen beiden Tabs hin und her ... bis mir etwas auffiel. Es gab Unterschiede, aber außerhalb des eigentlichen Darstellungsbereiches. Das Symbol für die Kompatibilitätsansicht im IE8 war im defekten Layout nicht sichtbar! Warum nicht? Der andere Unterschied war in der Statusleiste zu sehen, die funktionierende Seite kam von "Computer" die andere von "Lokales Intranet". Hatte es etwas mit dem berüchtigten Zonenmodell zu tun? Ich konnte im Menüpunkt "Internetoptionen" nichts finden. Aber im Menü "Seite" gibt es den Punkt "'Einstellungen der Kompatibilitätsansicht" und dort gibt es die Option "Intranetsites in Kompatibilitätsansicht darstellen".
D.h. alle Seiten aus dem Intranet (wo sich auch das Firmenrepository befindet) werden in der Kompatibilitätsansicht dargestellt, und in der Kompatibilitätsansicht geht das Layout kaputt! Seiten vom lokalen Computer (localhost, Dateisystem) und aus dem Internet werden im neuen, standardkonformen Modus angezeigt! Offensichtlich ist dies die Standard Einstellung des IE8, wobei mir der Sinn dieser Option wirklich schleierhaft ist. Noch merkwürdiger, dass sie  standardmäßig aktiviert ist.


PS: Der Grund für das defekte Layout in der Kompatibilitätsansicht war übrigens ein absolut positioniertes Element, dessen Style die folgenden Attribute fehlten:
right: 1px;
top: 1px;
width: auto;
overflow: hidden;