01 November 2015

Fixing WiFi repeater issues on Ubuntu 15

I'm quite happy with my switch from Windows to Linux. Despite my initial fears of having to compile the kernel because of driver issues, my Asus notebook with Xubuntu 15 worked out of the box and even WiFi works like a charm. At home I have my workplace under the roof and therefore the signal strength is quite bad. So bought a cheap WiFi repeater and the internet was fast again. Unfortunately sometimes it get slow again, especially after waking up from sleep. After spending some time with iw* command line tools I finally found out what was going on.

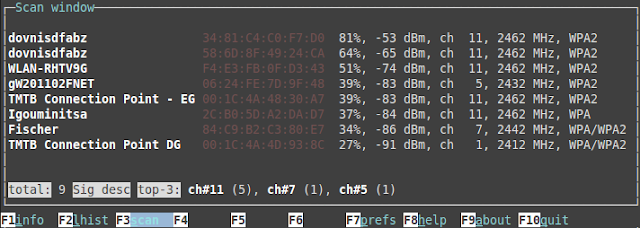
It seemed that for some reason I got connected to the WiFi access point in the basement and not to the repeater. You could use the excellent wavemon tool to monitor the signal strength of all available access points. (sudo apt-get install wavemon && sudo wavemon)

As you can see in the screenshot, two access points with the same name (first column) but different BSSIDs (second column) are visible.

The fix was really easy even if I had to use the mouse for it  ;-) Click on your WiFi symbol and choose "Edit Connections ...". Then choose your WiFi connection and press the "Edit" button. Click on the "WiFi" tab. In the BSSID dropbox choose the one you want to connect with (The one with the strongest signal shown in wavemon). Don't forget to press "Save". That's it.


29 March 2015

Detailed ELB Latency Percentiles with Lambda

Amazon's Elastic Load Balancer (ELB) gives you only one latency metric, aggregated over all requests, and only with the usual min, max and average statistics. The value of this information is very poor. For example, when our first service went live in the Cloud, we monitored only the average latency, which was a very good and stable around 7ms. Later I found out that half of our traffic consists of OPTION requests (due to a CORS configuration error) which were handled in less than one millisecond, but users actually using the functionality of our service experienced a latency between 100ms and 800ms. Problem was that those users were only a few percent of the traffic, so the really important data was covered by noise and invisible inside the average. What we needed were url specific metrics and percentiles, especially the 99th ones.

Lambda to the rescue

As CloudWatch doesn't give us more detailed metrics we were on our own. Luckily, we can instruct the ELB to write its access logs every 5 minutes to an S3 bucket. All the raw data we need is already there. Tools like Graylog or the ELK stack could analyse them, but it takes some time to set up a pipeline that digests those logs continuously and produce the desired metrics. But AWS has a new service in its portfolio that helped us to get the desired data even faster: Lambda.
AWS Lambda is a service that runs your javascript code in response to events. One kind of event is the creation of an object in a s3 bucket, in our case every time the ELB writes its access log. The lambda javascript code runs inside nodejs, and AWS provides its complete API as a nodejs npm module. That gives us the possibility to read the access logs whenever they got written, calculate the percentiles we are interested in, and write them back to CloudWatch as custom metrics. As soon as we have our specialized ELB metrics available in CloudWatch we can visualize/graph them, create alarms and show them on our dashing dashboard that is already capable of integrating CloudWatch metrics. 
Data Flow

The Code

As a web developer I'm quite familiar with Javascript, but never really worked with nodejs before. Nevertheless, I started with the AWS lambda sample and was able to implement everything I want to do on one rainy saturday. And I could test everything locally in nodejs. Beautiful! 
I've created a repository with a simplified version of the ELB percentile to CloudWatch lambda to give you a quick start if you want to do similar stuff. You need to adjust the bucket names and group-by regex to your conditions. The complete logic lives in lambda.js, there are some local tests in test.js. The zip_lambda.sh creates the upload package.
Actually, I spent most of the time fighting with cross account access policies and setting up the correct lambda invocation and execution roles, because we are using a multiple account setup where logs and CloudWatch metrics are living in different accounts.  Another problem was the AWS CLI, I could not automate the lambda upload process and had to do it manually. The zip_lamda.sh creates the necessary command, but it never worked for me. When you create the lambda function, make the timeout big enough to be prepared for sunday evening traffic spikes ;-)

21 February 2015

Think in Events not Logs - Logging Strategy

Events

Logging is the act of recording events. An event describes something that has happened. Therefore each event has
  • a timestamp (when it happened) 
  • and a description (what happened). 
Logs were invented by developers for doing ex post analysis of problems (aka debugging). Then their usefulness were quickly leveraged by operating personnel for monitoring system health. But today, human beings are only a minority of the logs audience. Computers systems that are constantly processing billions of log entries in the search for new insights (Big Data) or potential problems (Monitoring) are now a software tool category of their own.

A descriptive text that is written by a developer with only debugging in mind tends to be redundant, unstructured, ambiguous and incomplete. Computer systems have difficulties to parse and interpret such descriptions. The event description must reveal its data in a structured way that can be parsed easily by computers but is still human readable. A list of properties in a json-like format (key->value) is a reasonable way to go. This is sometimes described as structured Logging.

 {"timestamp":"2015-02-21 11:23:51.479 +01",
  "name": "address could not be saved", 
  "sessionId":"4711", "dbStatus":"42"} 

Log Levels

Log Levels are an anti pattern that originates in debugging and storage limitations. A log level (eg. verbose, warning, error) typically controls if an event is logged at all and how this event should be interpreted. Given cheap storage and computers processing log files, don't waste time with categorizing events during development time, configuring them at runtime, and then missing important information at problem time. The decision if an event is valuable and how to react should be deferred to operating time, the last responsible moment.

Log Management

That said, a logging strategy cannot stop here. Focussing on a single application is not enough. Todays computer systems are highly distributed systems running in cloud like environments where instances are volatile and storage is cheap. Log files have to be moved from machines to a persistent storage fast before a machine gets terminated. The many different logs must be aggregated into one format that can be easily accessed and analyzed, e.g. by extracting structured data and indexing it. If you have achieved this you can finally analyze your logged events and if the whole pipeline is fast enough, it will give you a better monitoring than just observing, CPU, RAM and IO metrics. 

The Future

From a future perspective it will look strange to think in log files, that are collected and moved to a central storage  for later processing. Parsing a myriad of ad hoc formats and trying to normalize them to do correlation will be no longer an issue as we are using only a few standardized formats. Log rotation, and high latency batch processing will be obscure because we will think in events and process them in real time. The accidental complexity of handling log files when events directly go into event streams and never touch the local disk. You can see a glimpse of the future in systems like Kinesis or Riemann that are build for events and not logs.

28 January 2015

GO TeamCity GO!

(tldr; Why TeamCity is still a time and money saving tool that can also be used for Continuous Delivery)

Today Continous Integration is a widely adopted practice and Continuous Delivery is the new state of the art. Many companies are now using (or 'abusing'?) their existing CI infrastructure to build pipelines for Continuous Delivery.

It turns out that this exercise works very well with tools like Jenkins, Hudson or Teamcity. The concept of having 'Builds' that are triggered by 'Commits' and producing 'Artifacts' can be easily extended to create delivery pipelines. Add the ability to chain 'Builds' and extend the trigger mechanism to fire when all preceding builds have been successfully finished. A 'Build' can be a classic compile build, a complex acceptance test, or the deployment to machines. It is just some kind of 'Job'. The possibility of 'Scheduled' triggers transforms your CI system to be a generic automation system. The traceability of 'Jobs' with logs and build numbers, some basic metrics and a nice Web-GUI lured many sysadmins exposed to CI systems to use them for automating all kind of stuff.

That is the way AutoScout went with TeamCity during the last years and with good success. Today, AutoScout has more than 1000 active build configurations executed by 51 agents. Many of those 'builds' aren't actually building stuff, but are

  • deploying apps to servers
  • updating elasticsearch indices
  • running database schema migrations
  • orchestrating fleets of test agents
  • and other crazy stuff you won't believe ;-)

We are not always happy with TeamCity. It tends to be a clicky-clicky tool producing clickops, because it has a nice GUI but a hard to use REST-API. And if you use Builds  for orchestrating other machines to do the real stuff (e.g. deployments) then you do not make good use of your agents resources. The agent is then blocked by idle waiting, wasting resources that cost real money. Over the years, TeamCity accumulated so many features that you need experience to do things the right way without shooting yourself in the foot.

A few months ago AutoScout decided to change its tech stack from DataCenter/Windows/.NET to Cloud/Linux/JVM. As this change is quite big and risky we have hired a lot of expertise from ThoughtWorks, the company that is also a well known proponent of Continuous Delivery. Their experts suggested to abandon TeamCity and give GO a try because GO is open source and built with Continuous Delivery in mind.

Now, after some hands on experiences with GO, I believe that you shouldn't replace a working and mature CI System like TeamCity with GO. My main argument is that GO is just another CI-Tool with no fundamental difference to TeamCity, Jenkins or whatsoever. It shares the same disadvantages
(clicky-clicky, server-agent model) but lacks many productivity features that TeamCity provides in a mature and battle proven way. Indeed I miss so many things in GO that I liked in TeamCity that I start a rant right now ;-)
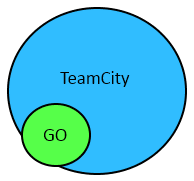
GO features are mostly a small  subset of TeamCity features

Displaying Logs

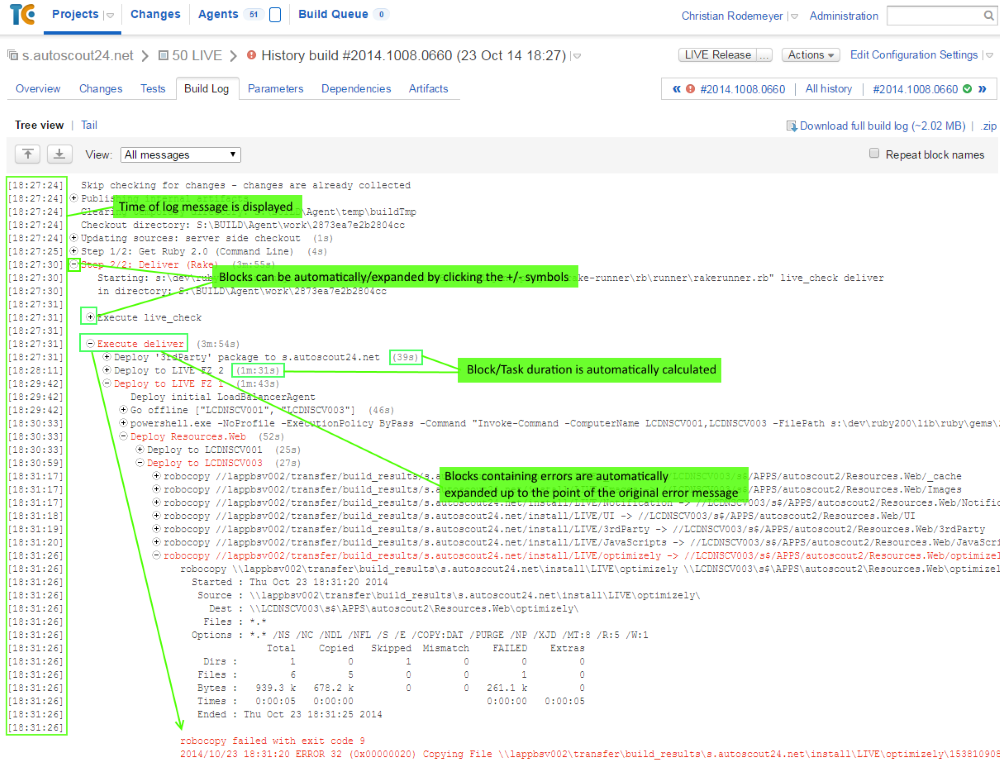
Investigating build logs is one very important use case whether you need to find the reason why a build fails or you want to know what a build makes slow. GO is a complete disappointed in this point. It shows you only a raw black&white dump of stdout and stderr mixed together. No indicators or any kind of help that could support you in analyzing. Maybe because only can start shell scripts. TeamCity, in contrast, knows what it executes (e.g. msbuild, rake, test runners, ...). It uses this knowledge to enhance logs with hints that makes them easy to analyze. First of all, errors are extracted and shown in a prominent place, so most often you don't need to go to the build log at all. If you drill down to the log, the log is presented in a hierarchical view, where blocks containing errors are expanded (and colored in red) while the rest of the log is collapsed. TeamCity also shows you for each line its ingestion time and the accumulated durations of tasks and subtasks. That makes it very easy to see where the build spent time.  GO can't even display a timestamp, so if your build takes 20 minutes, you have no clue which task caused this delay. TeamCity just tells you which task took how long, so you know immediately the reason for the performance degradation.
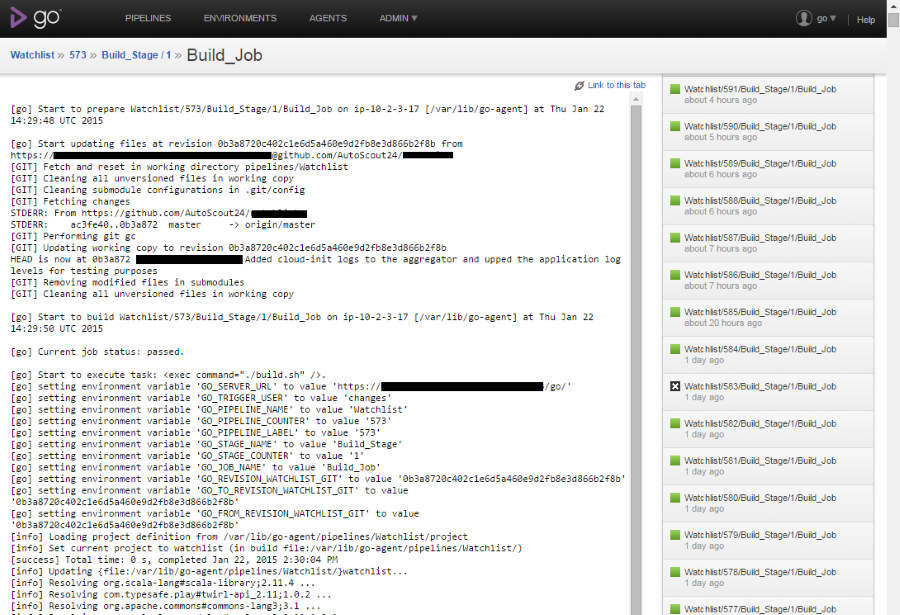
GO displaying a build log

TeamCity displaying a build log

Red Builds aka Failed Jobs

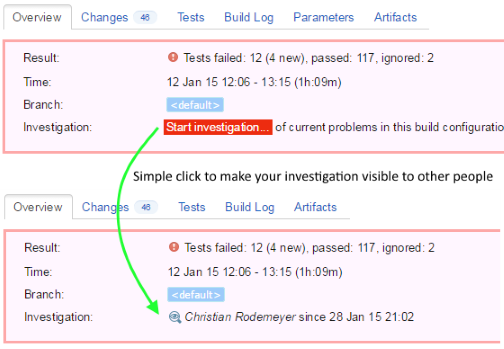
Red builds or failed jobs need to be investigated. In GO you can do silly things like wearing hats or hope that somebody takes care, in TeamCity you can start investigating a build and then the rest of the team knows that you are taking care.

Speaking or red builds, TeamCity has many ways to mark a build as failed even if the job returned a success, e.g.

  • the number of tests suddenly dropped significantly
  • the number of ignored tests increased significantly
  • the build took significantly longer than the last ones
  • the build times out
  • ...
GO can't do any of those things.

Living community 

Just try to google for some build related problems: Lots of answers for TeamCity, none for GO (which might be related to its name ;-) I wasn't able to find a GO community, again that may be the name, but visit the official GO community site or count the available community plugins. (most of the are written by ThoughtWorks employees anyway). TeamCity has a living community and in case googling doesn't solve your problem, Jetbrains has a fast and helpful support. 

Native AWS support 

TeamCity can operate a fleet of agents on Amazon EC2 instances. Depending on the current load (pending jobs) it can create, start or stop agents. This allows you to use very fast C4 instance types, which will make your builds faster, but in a very cost effective way, because those instances will live only for those few hours per day in which they are actually needed. GO again has nothing to offer in this area, you have to build scaling up and down by your own script or just pay 24/7 for agents you don't use.

Miscellaneous TC features where GO is inferior

  • Auditing/Permissions: If you have more than one team TeamCity allows you manage permissions and it has a good auditing feature that shows you which user changed what and when. GO can show you the diff between two versions of the global config.xml file.
  • Custom build numbers in TeamCity, incrementing only numbers in GO.
  • Sophisticated environment variable setting in TC, predefined ones in GO 
  • Jobs can interact with Teamcity, e.g. update status data, nothing in GO
  • Jobs can have arbitrary names and descriptions in TC, GO doesn't allow whitespace in names, leading_to_strange_conventions.
  • all thinkable variants of triggers and dependency chains between jobs allows you to build sophisticated pipelines in TC
  • job queues are visible in TC, making it easy to debug non starting and pending builds. In GO you have no hint when you job will start or to manipulate the queue when something went wrong. I have seen jobs hanging in GO forever because agents requirements were missing.
  • Good history of deployments/builds from the past. You see which commits are in with deployment, and you can rollback to an older version directly from this history view.
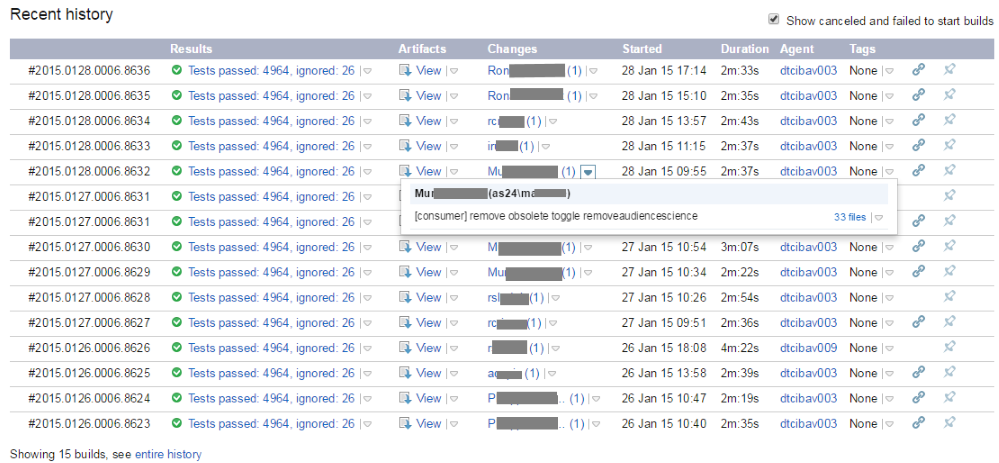
There are still more points where TeamCity outperforms GO (backups, recovery, auto updating agents, ...). I hope I have listed enough to show you mature TeamCity is compared against GO. If you have a problem there is a very high chance that TeamCity has a solution. With GO you will find yourself running into limitations or living with crude workarounds which make your teams less productive. 

Conclusion

If you have a working and mature CI System (Jenkins, TeamCity, ...) don't switch to GO just because you want to do Continuous Delivery. GO has the same disadvantages but lacks many important productivity features. Either evolve your existing CI System to also deliver software or try out a radical different approach like hubot deploy.