08 May 2020

Fedora32, Gnome, Wayland and Nvidia


Problem


Using Fedora since version F30 with Intel or Nouveau driver. I like it a lot because Wayland/Gnome works very well with monitors having different DPI, e.g. Retina Display on Notebook combined with an old office monitor. Recently I bought a new PC for working (Ryzen 7) and gaming (Nvidia Geforce RTX 2070). I installed Fedora 32 and Windows 10 on the new system and was happy to see my system working without problems. For work, I would use Fedora and for Gaming, I use Windows 10. I was very pleased with the Fedora experience, everything worked as smooth as silk, not tearing or flickering issues at all. (I had bad experiences in the past, normally the first thing I do on Linux is disabling the Nvidia card and use Intel Processor Graphic only.)
But after a few hours of working, I noticed that the system was not as fast as expected. `htop` showed that all 16 cores where utilized by gnome-shell for 2-3%. As soon as I had Chrome opened or doing stuff with Visual Studio Code CPU load on all cores spiked. After doing some research and experiments I discovered that my super fast RTX 2070 graphics card is not even near to be supported by the nouveau driver. Everything is done by the CPU, no hardware acceleration at all. As the system has no Intel Processor with integrated graphics, I tried the proprietary Nvidia driver again.

My System

Nice summary also available in Gnome Settings / About

  • Date (date -I): 2020-05-03                                                             
  • Kernel (uname -r): 5.6.8-300.fc32.x86_64                                    
  • Gnome (gnome-shell --version): GNOME Shell 3.36.1  
  • CPU (cat /proc/cpuinfo | grep -m1 "model name"): AMD Ryzen 7 3700X 8-Core Processor 
  • Graphics (lspci | grep VGA): TU106 [GeForce RTX 2070] (rev a1) 

Helpful Tools


  • `echo $XDG_SESSION_TYPE` prints X11 or Wayland
  • show current kernel parameters `cat /proc/cmdline`
  • show currently loaded kernel modules `lsmod | grep nvidia` or `lsmod | grep nouveau`
  • Instructions to install Nvidia driver

Changing Kernel Parameters


  • `sudo vim /etc/default/grub` to edit `GRUB_CMDLINE_LINUX="..."`
  • `sudo grub2-mkconfig -o /boot/efi/EFI/fedora/grub.cfg` to apply changes
  • `reboot`

/etc/modprobe.d/

I'm not an expert in this topic, but I also needed to blacklist modules and set module parameters in `/etc/modeprobe.d/nvidia.conf`. To activate those changes it was necessary to regenerate the /boot/initramfs-* files. `sudo dracut --force` is the most simple and dangerous way as it generates and overwrites the intiramfs for the currently running kernel. Better move the existing initramfs away with `sudo mv /boot/initramfs-$(uname -r).img /boot/backup-initramfs-$(uname -r)` before
starting experiments.

Findings

After following the [instructions](https://www.if-not-true-then-false.com/2015/fedora-nvidia-guide/)
the system booted up fine and I instantly saw that moving windows or using Chrome
did not trigger high cpu load any more. Even WebGL Demos in Chrome were running with neglectable cpu load. But then I noticed I was running on X11 and not on Wayland any more. I googled around and could not find any useful information if it is possible to use the NVIDIA driver
with wayland. So I tried to enable it.

Enabling Wayland in Fedora32 for proprietary Nvidia driver

Comment out the gdm-disable-wayland in `/usr/lib/udev/rules.d/61-gdm.rules`
# disable Wayland when using the proprietary NVIDIA driver
DRIVER=="nvidia", RUN+="/usr/libexec/gdm-disable-wayland"
Enable experimental kernel mode setting (from NVIDIA perspective)

  • Add `nvidia-drm.modeset=1` to `GRUB_CMDLINE_LINUX`
  • Add `options nvidia-drm modeset=1` to `/etc/modprobe.d/nvidia.conf`
  • update grub and initramfs and reboot

Running on Wayland with proprietary Nvidia driver

After reboot Wayland was active, and I could log in. Looks promising. `nvidia-settings` was no longer working, but `nvidia-smi` was. Also lsmod shows me that the nvidia driver was active. Firefox and Gnome looked fine, no cpu usage spikes. By then it was time for lunch and I suspended
the computer. After lunch I pressed Space and saw corrupted log in screen but was able to login. Unfortunately, all the graphics were corrupted, you could see only the rectangles of the windows. Still I was able to reboot, and my system was usable again.
I spent hours trying to diagnose and fix those issues, but no relevant errors in journalctl, and no findings with Google. It tried the systemd suspend mechanism as described in the Nvidia drivers readme but with no success. In the end I decided to go without suspend capability and just turn off and on again.
On the next day, I continued to do some work again. When using Visual Studio Code, Gnome immediately crashed. It seems that all applications running in Xwayland (a compatibility mode
for applications not running natively on Wayland) crashed after a while, especially after resizing the window. Just resizing an Xwayland app triggered the crash.

Conclusion - Back to X11 with proprietary Nvidia driver

So in the end, as long as Chrome and Visual Studio Code are not natively supporting Wayland, Wayland is unusable with Nvidia drivers. It's a pity, that a company earning lots of money with their pretty fast cards is not able to provide a stable linux driver, a thing that a few volunteers were able to to do with the nouveau driver. It would be nice if Nvidia would a least help them a little bit to get support for newer Nvidia cards into the nouveau driver.

12 February 2017

How to gunzip AWS Loadbalancer logs with nodejs


The new Application Loadbalancer (ALB) from AWS stores it's access logs in a slightly different format to S3 than the classic ELB.
  1. logs are written every 5 minutes now
  2. some fields are added at the beginning of each line and some at the end
  3. logs are written as gzipped streams with the ending .gz
I am parsing the access logs with a custom lambda function and forward them to an Elasticsearch cluster. The new fields in front of the existing ones broke my parsing, but that was easily fixed. My lambda function uses nodejs as a runtime, so `zlib.gunzipSync(log)` was the easiest way to gunzip the log files. Everything looked good, no errors all unit tests passing, but after I switched to ALB on production I noticed a large drop in the number of requests written to Elasticsearch.

I downloaded some log files and noticed strange values, like negative compression ratios, when testing the file with gunzip:
$ gunzip -lv fk0e6u3y.log.gz 
method  crc     date  time           compressed        uncompressed  ratio uncompressed_name
defla d26f8a35 Dec  7 10:45               18278                3052 -498.3% fk0e6u3y.log
My first thought was 'ahh corrupt log files'. But when I actually gunzip the file I got no errors and a reasonable number of lines (requests). Then I wrote a little nodejs app that uses zlib to gunzip the file. Only the first few lines were unzipped, but again without any error. That was mysterious. After a lot of googling, I finally found out that the gzip file format allows several concatenated chunks of compressed data. But gunzip shows only the data for the first chunk, thus the weird output and negative compression ratio. And nodejs had an issue too, it extracts only the first chunk and silently ignores the rest. As AWS supports only nodejs v.4.3.2 no fix was available.

But there is an easy workaround. Lambda runs on Amazon Linux and nodejs can start arbitrary processes on the host. So reading the data from S3 and then passing the data to an external gzip process did the trick:

execSync('gzip -d -c', {input: data.Body}).toString('ascii')

Here the data is passed from data.Body (a nodejs buffer) to STDIN of the gzip process. STDOUT is converted to an ascii string. That's nearly as easy as the original zlib version and it is working like a charm on production now. It might break in the future if AWS disallows starting external processes or removes gzip from the host.

22 September 2016

Blue Green Deployments with AWS CloudFormation AutoScalingRollingUpdate Policy


At tado° we are doing blue-green deployments for our web and application servers by simply updating AWS CloudFormation stacks. Our architecture is classical: EC2 instances in an Auto Scaling Group (ASG) behind an Elastic Load Balancer (ELB). 


We follow the immutable server pattern and never modify existing instances. Instead, we are use the AutoScalingRollingUpdate policy to replace old instances with new ones. CloudFormation has the additional ability to roll back to the previous state if something goes wrong. If the old instances keep running the rollback is very quick without any user visible downtime.

The problem is that the AutoScalingRollingUpdate policy was not invented for blue-green deployments but for replacing instances in small batches. Configuring the policy to properly do a blue-green deployment in one batch was more tricky than expected. CloudFormation still lacks some little piece of functionality which so I needed to workaround.

The AutoScalingRollingUpdate policy determines how instances get replaced when the LaunchConfiguration changes. It has two important properties:
  • MaxBatchSize controls how many instances can be created or terminated at the same time. A blue-green deployment is a special rolling update done in one batch. First, create all new instances, wait until the application is warmed up and healthy, and then terminate all old instances. We set MaxBatchSize to equal the MaxSize of the ASG to create and terminate all instances in one big batch.  
  • MinInstancesInService controls how many instances must keep running during the update. If you omit this parameter it defaults to zero. This means CloudFormation will terminate all old instances while starting new ones in parallel. Clearly not what you want for zero downtime blue-green deployments. This should be set to the current number of instances in service. 

One of the benefits of Auto Scaling is that it adapts the number of running instances to the current load. E.g. during the night two instances might be sufficient but at prime time you need ten. The number of needed instances is reflected in the DesiredCapacity property of the ASG and changes over time.

Autoscaling instance over time
So it is vital to set MinInstancesInService to the current DesiredCapacity of the ASG before starting the update. But when we deployed a service during prime time we saw that instances were terminated until we had only two left when we needed ten! Not good!
I made two mistakes. The first was hard coding the DesiredCapacity of the ASG in our CloudFormation template so the current value got overwritten on each deployment. In this case, the ASG instantly adjusts its capacity. Fixed that by just not specifying the DesiredCapacity at all in the template. The second one was naively setting MinInstancesInService to the MinCapacity of the ASG. Bummer! I tried to get the current value with the intrinsic function Fn::GetAtt that gives you access to attributes of stack resources. But when I tried it out, CloudFormation complains about not knowing this attribute. It turned out that no AutoScalingGroup attributes are exposed inside a CloudFormation template! As a workaround, I used the CloudFormation API to query the name of the ASG resource and were then able to use the AutoScaling API to get the current DesiredCapacity. I also introduced an external parameter and assigned it to the MinInstancesInService property so I could pass this value to the stack before applying the update. Luckily, we are using AutoStacker24 to update stack so this workaround could be done with a few lines of ruby code. But it would be even better if AWS would expose ASG attributes to the Fn::GetAtt function out of the box.

If you are still reading there was another interesting issue with TerminationPolicies property. Several times experienced the strange behaviour that on rollback (e.g. because of failing healthchecks) CloudFormation first creates new instances with the old LaunchConfiguration while terminating the still running old instances. To fix this I configured the OldestLaunchConfiguration and OldestInstance policies in exactly that order.  In addition to keeping the existing instances in case of rollbacks it also allows us to do instance recycling. Some services start to get slower and slower after a few days of work, so an easy way to fix this was to scale up manually, wait until the new instances are in service and then scale down again. This will automatically terminate the oldest instances.

Learnings

  • don't specify DesiredCapacity on the AutoScalingGroup in the template, it should be determined by the scaling policies of the ASG 
  • Set MaxBatchSize to equal the MaxSize of your ASG to have only one batch.
  • Set MinInstancesInService to the current number of running instance. Ideally, this should be MinInstancesInService: "@ASG.DesiredCapacity" or {"Fn::GetAtt": ["ASG", "DesiredCapacity"]} but CloudFormation doesn't support it (yet). Use  API/scripting to work around.
  • Use TerminationPolicies for making rollbacks keep the existing instances
    • OldestLaunchConfiguration
    • OldestInstance

20 March 2016

YAML CloudFormation Templates

I like CloudFormation a lot. I can easily write a template to describe my AWS infrastructure or I can start with one of the many existing templates an snippets and customize it to my needs. I put the template under version control and let CloudFormation do all the heavy lifting of creating and updating infrastructure. No need to write scripts, recipes or playbooks.
There is one thing I don't like so much: a template has to be written in  JSON. Compared to XML it's a much better serialization format but it is still not optimal for humans. No comments, difficult to refactor (missing commas when moving lines) and you have to quote everything. Luckily there are some projects like YAML or Hjson who set humans first and give us a more user friendly language for writing data documents. YAML is the format used by Ansible, Swagger, JenkinsJobBuilder, Grails, tools that I'm using a lot, and so I my wish got bigger and bigger to have CloudFormation YAML templates. As JSON is interchangeable with YAML  support should be very easy. For example, in Ruby the conversion is a one liner: YAML.load(File.load(template)).to_json. A CloudFormation YAML template could look like this:

CloudFormation YAML template
I'm already using autostacker24 for deploying my CloudFormation templates, mainly because it provides string interpolation for clumsy CloudFormation functions, but that's worth a blog post of its own. The important thing is that the good guys at AutoScout24 accepted my pull request to support YAML templates! Using autostacker24 to update a CloudFormation stack is as easy as typing:

$ autostacker24 update --template my-template.yaml --stack my-stack

I really love my YAML templates now, they make me much more productive. No more missing commas, easy to inline long text (with '|') for UserData and they are so much more readable than JSON. Look at this template from the AWS examples and its YAML counterpart to convince yourself! You can skip the mappings definitions at the beginning and jump to the more interesting resource definitions near the bottom. Autostacker24 can also convert templates from and to YAML.

Now its your turn, give autostacker24 a try and if you like YAML, please spread the word. Maybe AWS will support YAML natively some day in the future. Pull requests and issues are are always welcome.

03 February 2016

Don't use curl in Dockerfiles

Today I broke a production server because a docker image had missing files. How could this happen? The build was green, the app was tested, docker built the image without any errors.
When I looked at the Dockerfile I found some curl commands to download additional .jar files directly from the internet. They contained some specialized logging logic that was not used during the tests, but made the application fail in production. It turned out that those files no longer exist on the internet. And that's the reason for my provocative blog titel:
curl will exit with code 0 even if the server responds with a 404 Not Found status code, because from a protocol point of view everything was correct. In this case scripts and dockerfiles will not fail but silently ignore failed downloads. To be honest, there is a --fail option for curl, but it's not fail safe and you have to know it. That's the reason why I now prefer wget for downloading files in scripts. It will by default return a non zero exit code if the download fails, and therefore failing the script. If you need to pipe the downloaded file to stdout you can do it with wget -O - <url> too.

01 November 2015

Fixing WiFi repeater issues on Ubuntu 15

I'm quite happy with my switch from Windows to Linux. Despite my initial fears of having to compile the kernel because of driver issues, my Asus notebook with Xubuntu 15 worked out of the box and even WiFi works like a charm. At home I have my workplace under the roof and therefore the signal strength is quite bad. So bought a cheap WiFi repeater and the internet was fast again. Unfortunately sometimes it get slow again, especially after waking up from sleep. After spending some time with iw* command line tools I finally found out what was going on.

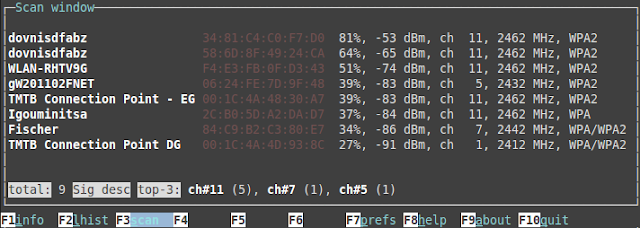
It seemed that for some reason I got connected to the WiFi access point in the basement and not to the repeater. You could use the excellent wavemon tool to monitor the signal strength of all available access points. (sudo apt-get install wavemon && sudo wavemon)

As you can see in the screenshot, two access points with the same name (first column) but different BSSIDs (second column) are visible.

The fix was really easy even if I had to use the mouse for it  ;-) Click on your WiFi symbol and choose "Edit Connections ...". Then choose your WiFi connection and press the "Edit" button. Click on the "WiFi" tab. In the BSSID dropbox choose the one you want to connect with (The one with the strongest signal shown in wavemon). Don't forget to press "Save". That's it.


29 March 2015

Detailed ELB Latency Percentiles with Lambda

Amazon's Elastic Load Balancer (ELB) gives you only one latency metric, aggregated over all requests, and only with the usual min, max and average statistics. The value of this information is very poor. For example, when our first service went live in the Cloud, we monitored only the average latency, which was a very good and stable around 7ms. Later I found out that half of our traffic consists of OPTION requests (due to a CORS configuration error) which were handled in less than one millisecond, but users actually using the functionality of our service experienced a latency between 100ms and 800ms. Problem was that those users were only a few percent of the traffic, so the really important data was covered by noise and invisible inside the average. What we needed were url specific metrics and percentiles, especially the 99th ones.

Lambda to the rescue

As CloudWatch doesn't give us more detailed metrics we were on our own. Luckily, we can instruct the ELB to write its access logs every 5 minutes to an S3 bucket. All the raw data we need is already there. Tools like Graylog or the ELK stack could analyse them, but it takes some time to set up a pipeline that digests those logs continuously and produce the desired metrics. But AWS has a new service in its portfolio that helped us to get the desired data even faster: Lambda.
AWS Lambda is a service that runs your javascript code in response to events. One kind of event is the creation of an object in a s3 bucket, in our case every time the ELB writes its access log. The lambda javascript code runs inside nodejs, and AWS provides its complete API as a nodejs npm module. That gives us the possibility to read the access logs whenever they got written, calculate the percentiles we are interested in, and write them back to CloudWatch as custom metrics. As soon as we have our specialized ELB metrics available in CloudWatch we can visualize/graph them, create alarms and show them on our dashing dashboard that is already capable of integrating CloudWatch metrics. 
Data Flow

The Code

As a web developer I'm quite familiar with Javascript, but never really worked with nodejs before. Nevertheless, I started with the AWS lambda sample and was able to implement everything I want to do on one rainy saturday. And I could test everything locally in nodejs. Beautiful! 
I've created a repository with a simplified version of the ELB percentile to CloudWatch lambda to give you a quick start if you want to do similar stuff. You need to adjust the bucket names and group-by regex to your conditions. The complete logic lives in lambda.js, there are some local tests in test.js. The zip_lambda.sh creates the upload package.
Actually, I spent most of the time fighting with cross account access policies and setting up the correct lambda invocation and execution roles, because we are using a multiple account setup where logs and CloudWatch metrics are living in different accounts.  Another problem was the AWS CLI, I could not automate the lambda upload process and had to do it manually. The zip_lamda.sh creates the necessary command, but it never worked for me. When you create the lambda function, make the timeout big enough to be prepared for sunday evening traffic spikes ;-)